Please put an active hyperlink to our site (www.rusnature.info) when you copy the materials from this page
Physical Geography of Northern Eurasia
Biodiversity and Productivity of Ecosystems
<<< Geography of Diversity of Animal
Populations | Physical Geography Index | Spatial Patterns of Microbial Communities >>>
Spatial Patterns of Phytomass Distribution, Primary Productivity
and Decay
Many studies have shown that a close correlation exists between the level of
species-richness and the total biomass of a community (Chernov, 1975, 1991; Zlotin, 1975).
The biomass of an ecosystem is the dry matter of living organisms present at a given
moment and expressed as unit of weight per unit of area (i.e., metric tonnes ha-1).
Phytomass (plant mass) constitutes the largest share of biomass, while zoomass represents
only a small fraction. At the global scale, 99 per cent of biomass is phytomass. Features
of the distribution of net primary productivity (NPP), determined for all components of
phytomass (including green and woody parts and roots) correlates closely with the patterns
of distribution of living phytomass following the north-south gradient of biological
productivity (Rodin and Bazilevich, 1965; Bazilevich et al., 1986, 1993; Bazilevich,
1993). This section builds on an extensive survey on biomass and productivity of
ecosystems across the FSU which has been conducted by Bazilevich and her co-workers and
summarized in Bazilevich (1993). The survey encompasses data for over 2000 sites analysing
structure and productivity of 126 plant communities, described in the geobotanical map of
Sochava (1964). On the basis of this analysis, maps of biomass structure, and primary
production in zonal habitats (mountainous areas have not been considered) have been
compiled by Bazilevich et al. (1993). The data analyzed refer mostly to well-developed or
potential vegetation. Regional averages, derived from these statistics, can be higher than
many Western estimates, which are often based on data for managed or degraded vegetation
and soils (Olson et al., 1983). This difference in approach should be kept in mind when
considering these data in an international context. Despite the large number of sample
areas, data for certain regions are still lacking. Nevertheless, this information is
valuable for understanding patterns of formation of living and dead biomass across
Northern Eurasia.
The highest amount of living phytomass (Figure 7.13) is typical of mixed broad-leaved
coniferous forests and southern taiga of European Russia.
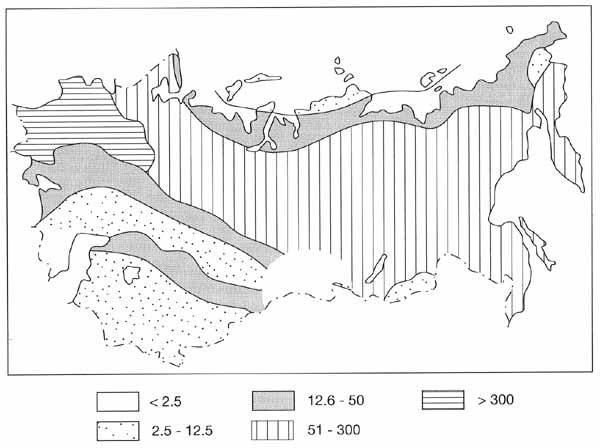
Fig. 7.13 Distribution of living phytomass (t ha-1). After
Bazilevich et al. (1993)
Both northward and southward of the forest biome, the amount of living phytomass
decreases. Northward, the decrease occurs due to the lack of heat, while in the south
increasing aridity is the major factor. Biomass and NPP of steppe and tundra have
structures different from that of forest ecosystems. In steppe, in the arctic and typical
tundra, the below ground biomass (roots) prevails while in forests the above ground woody
components of phytomass (trunks and branches) dominate. In southern tundra, the ratio
between below ground and above ground plant reserves varies. In habitats dominated by
herbs and some shrubs below ground reserves are greater. The ratio is on average 10 for
herbs (although it varies widely between 4 and 40) and 0.8-7 for shrubs. However, in
ecosystems, dominated by Vaccinium, and in mountainous ecosystems of the north-east, where
Betula exilis prevails, the ratio is 0.2-0.5 (Bazilevich and Tishkov, 1997).
The accumulation of dead material depends on living phytomass production and on the
climatic factors which determine decomposition rates. In general, reserves of dead
phytomass are higher in Asia than in Europe. The highest amount of dead phytomass (Figure
7.14) is typical of the taiga of Western Siberia, where peat bogs occupy extensive areas,
as well as of dwarf cedar and alder forests of Kamchatka.
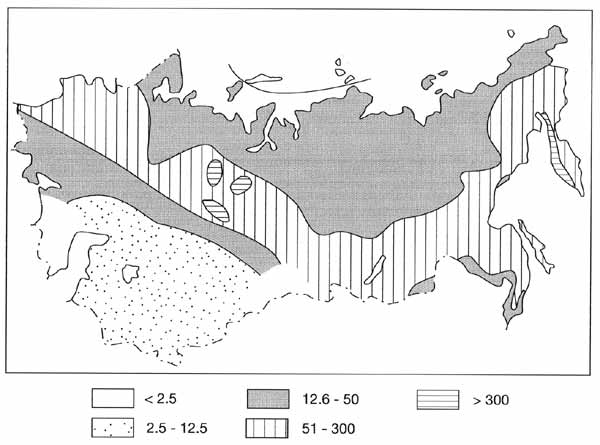
Fig. 7.14 Distribution of dead phytomass (t ha-1). After
Bazilevich et al. (1993)
With respect to the ratio between dead and living phytomass, the amount of dead
material is higher in most tundra ecosystems. Both the amount of dead plant mass and the
ratio increase from polar deserts southwards, with the ratio peaking in southern tundra
(Bazilevich and Tishkov, 1997). There is a clear contrast between zonal ecosystems and
marshes. In marsh ecosystems of tundra and forest-tundra biomes, the reserves of dead
phytomass exceed the reserves of living phytomass by the factor of 7-8 (Bazilevich and
Tishkov, 1997).
Figure 7.15 illustrates the distribution of NPP across Northern Eurasia. Apart from
latitudinal changes in climate, an important factor, affecting primary productivity and
decay, is continentality of climate.
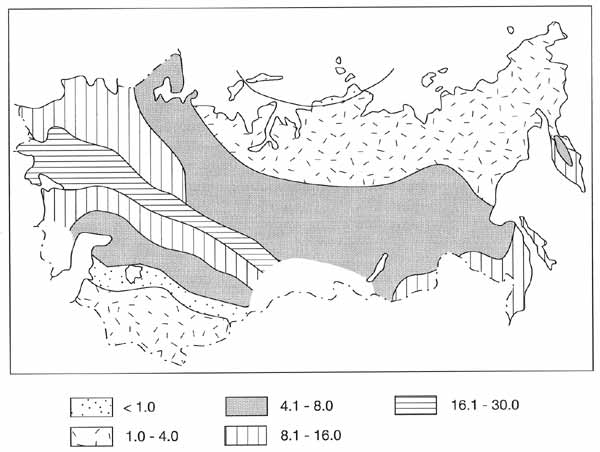
Fig. 7.15 Distribution of net primary productivity (NPP) (t ha-1
a-1). After Bazilevich et al. (1993)
Due to the extremely low winter air and soil temperatures and low moisture supply,
Central and Eastern Siberia are characterized by lower annual production than the European
territory, Western Siberia, and the Pacific sector. The greatest zonal contrasts in
productivity are typical of the European sector and Transcaucasia. In the Pacific sector,
due to the influence of the ocean, zonal contrasts are reduced.
In the polar thermal belt, NPP increases significantly from polar deserts to the
southern tundra ecosystems. This change is pronounced especially clearly on the Taymyr
peninsula, where a classic succession of polar biomes occurs (Chernov, 1985). NPP of the
southern tundra ecosystems reaches about 5.0 t ha-1 a-1, while NPP
of the polar desert ecosystems at the northernmost limit of the peninsula near Cape
Chelyuskin does not exceed 0.25 t ha-1 a-1. Due to the relatively
mild climatic conditions and the domination of herbs, the highest values of NPP in the
tundra biome occur in the coastal areas of the Chukchi peninsula. In the southern tundra
of Taymyr, plant reserve and NPP are higher than in similar ecosystems in the Urals,
Yamal, and Eastern Siberia because southern Taymyr is sheltered to the north by the
mountains and because the soils here are often richer in nutrients (Bazilevich and
Tishkov, 1997). To evaluate decomposition rates in natural ecosystems, the ratio between
dead phytomass (DPH) and NPP is frequently used (Vtorov and Drozdov, 1980; Isachenko,
1985; Bazilevich, 1993). Low ratios indicate rapid biological cycling. The DPH to NPP
ratio varies between 7-8 in polar deserts and reaches 20 in southern tundra (Bazilevich,
1993). High values of DPH/NPP ratio indicate a low intensity of biological cycling in the
tundra biome (lower values typical of polar deserts are explained by the very low NPP).
In the forest biome, a general southward increase in NPP is observed. However, the
north-south gradient varies between different sectors of the forest zone. The increase is
best expressed in the European sector and Transcaucasia, which accommodate a greater
variety of forest ecosystems, and is less distinct east of the Urals. Thus, in the
European territory and Transcaucasia, the NPP of humid subtropical forests exceeds NPP of
northern taiga by a factor of four (20 and 4.5 t ha-1 a-1,
respectively). In Western Siberia, the difference between the NPP of mixed forests, which
occur in the south, and the NPP of northern taiga is much smaller (10 and 4 t ha-1
a-1). In Central Siberia and especially in Eastern Siberia, where forest
ecosystems are represented mainly by monodominant larch communities, the difference
between the NPP in the north and south of the forest zone is even lower (3 and 61 ha-1
a-1). In the Pacific sector, the NPP of forest ecosystems and the north-south
differences increase again, almost attaining the European indices (about 4 t ha-1
a-1 in northern taiga and 13-14 t ha-1 a-1 in
broad-leaved forests). In relation to the European and West Siberian sectors, the taiga
forests of Central and Eastern Siberia are characterized by lower annual productivity,
which results from higher aridity and the extremely low winter air and soil temperatures.
Table 7.1 illustrates the effects of variability in temperature and precipitation on
various plant communities and shows that the thermal factor is a more important control
over productivity than moisture availability.
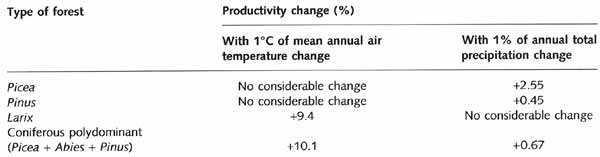
Table 7.1 Annual productivity changes (%) of the taiga forests with
changes in temperature and precipitation
The sensitivity of various plant communities to temperature change is not the same.
Polydominant and Larix forests are most sensitive while Picea forests have a limited
reaction to change in precipitation. Larix forests cover 2.5 million km2 in
Siberia (Walter, 1980) and the projected global warming may enhance their role as an
important sink of carbon dioxide.
The intensity of biological cycling in the forest zone is much higher than that of the
polar belt. It increases southwards distinctly across the forest biome. For example, in
the European northern taiga the DPH/NPP ratio varies between 7 and 8, indicating slow
decomposition, while in broad-leaved forests it is as low as 3. Across the forest biome,
the highest decomposition rates are typical of broad-leaved forests, while the lowest
rates are characteristic of the Larix forests of Siberia (Bazilevich et al., 1993).
NPP reaches the highest values in the meadow steppe ecosystems of the forest-steppe
biome and in true steppes, attaining 20-22 t ha-1 a-1. While in
forests above ground production dominates, below ground production is more important in
steppes. Total NPP decreases from the European sector eastwards and is lowest in the
steppes of Eastern Siberia in line with the increasing aridity of climate. With increasing
continentality of climate and stress on plants due to fluctuations in temperature, a
greater portion of organic matter becomes concentrated in soil, and the share of below
ground parts in total primary production increases from the European to Asiatic steppes.
In the steppes of Eastern Siberia, the below ground parts contribute up to 90 per cent of
total production. The DPH/NPP ratio increases eastwards from approximately 1 in the
European territory and Western Siberia to about 2-3 in Central and Eastern Siberia, where
a lack of moisture and low air and soil winter temperatures result in lower decomposition
rates. Deserts and semi-deserts of the subboreal and subtropical belts are characterized
by diverse plant communities and, consequently, NPP varies strongly between the
ecosystems. Productivity of arid landscapes is controlled primarily by non-climatic
factors such as type of bedrock and soil, underground water availability, mineralization
of water, and soil salinity (Bazilevich et al., 1993). Table 7.2 illustrates the
differences in productivity of plant communities developing in proximity to each other on
loamy and sandy soils.
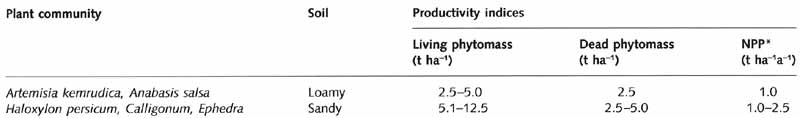
Table 7.2 Productivity of the desert vegetation formations developing on
loamy and sandy soils
* Net primary productivity. Source: Bazilevich et al. (1993).
Climatic controls are of secondary importance since there is comparatively little
variability in the atmospheric moisture supply. As a result, variation in productivity
between the sectors is less pronounced than in forest and steppe biomes. For example,
productivity of the Kazakh semi-deserts is almost identical to productivity of the
semi-deserts of Azerbaijan (Bazilevich et al., 1993). In comparison with steppes, the NPP
of arid ecosystems is much lower (1-7 t ha-1 a-1). Decomposition
rates are lower than in steppe ecosystems because perennial grasses and especially above
ground woody parts of desert shrubs are not readily decomposed and in contrast to steppes,
in deserts and semi-deserts dead phytomass is always lower than living phytomass.
A southward increase in productivity is typical not only of zonal ecosystems developing
on watersheds, but also of azonal communities, such as bogs and riparian grasslands, which
receive additional moisture and a significant input of nutrients (Figure 7.16).
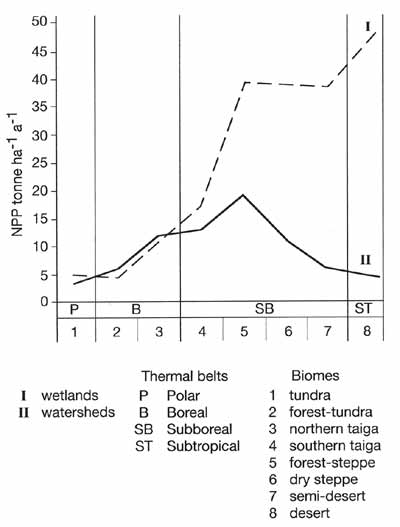
Fig. 7.16 Net primary productivity (NPP) of zonal (watersheds) and
azonal (wetlands) ecosystems in major biomes. After Bazilevich et al. (1986)
In the north, the difference between productivities of zonal and wetland ecosystems is
marginal. South of the southern taiga biome, productivity of wetlands increases, their NPP
exceeding the NPP of zonal communities by a factor of 2 in semi-arid areas and by up to a
factor of 40 in deserts.
A combined analysis of spatial patterns of NPP (Zlotin and Bazilevich, 1993), radiation
balance (Uchijima and Seino, 1987), and a radiation dryness index (Henning and Flohm,
1977) has confirmed that an intimate relationship exists between thermal and moisture
resources and NPP (Varlygin and Bazilevich, 1992). Except for the arid biomes, the NPP of
zonal ecosystems increases in line with heat supply. In deserts, the opposite is true. The
analysis of links between productivity and climatic factors permits to evaluate a shift in
zonal boundaries in response to global climate change. The greatest change is likely to
occur in the north. In the polar biomes, a noticeable shift in boundaries of biomes may
occur with additional input of energy of 0.1 W a-1 and in the boreal biome of
0.2 W a-1. NPP increases by a factor of 1.5 and 2, respectively. Further south,
an increase of 0.5-1.2 W a-1 in radiation budget is required to produce a
1.2-fold increase in NPP (Varlygin and Bazilevich, 1992).
<<< Geography of Diversity of Animal
Populations | Physical Geography Index | Spatial Patterns of Microbial Communities >>>
|


