Please put an active hyperlink to our site (www.rusnature.info) when you copy the materials from this page
Physical Geography of Northern Eurasia
Biodiversity and Productivity of Ecosystems
<<< Spatial Patterns of Phytomass
Distribution, Primary Productivity and Decay | Physical
Geography Index | Geography of Animal Communities
>>>
Spatial Patterns of Microbial Communities
Data on the geography of density, mass, and diversity of microorganisms (i.e., bacteria
and fungi), in Northern Eurasia are fragmentary, with the most complete up-to-date results
being obtained through research under the International Biological Programme (IBP).
The major part of microbial production in terrestrial ecosystems is associated with
soils. Integrated microbial activity and density of microorganisms can be evaluated by
estimating the CO2 (carbon dioxide) output from soil to the atmosphere,
providing that the microbial component of the flux is known. It is assumed that
microorganisms account for about 30 per cent of the total CO2 flux from soils
(Coleman, 1973; Zlotin, 1975). Data on CO2 output (g m-2day-1),
summarized by Kobak (1988) for various soil types of Northern Eurasia, show that
variability in the CO2 flux is relatively small. The flux from humid temperate
soils exceeds the flux from tundra or desert soils by a factor of 3-8. The difference in
biomass of soil bacteria and fungi, found in the less productive tundra and desert biomes
and more productive forest biomes, is quite small (Table 7.3).
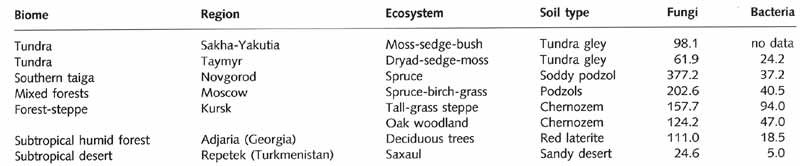
Table 7.3 Microbial biomass (g m-2). Source: Mirchink and
Panikov (1985), Parinkina (1989).
Soil microbial activity is assessed using a simple method based on the level of
cellulose decomposition (Zlotin and Chukanova, 1973). Strips of cotton cloth are buried
into the most biologically active layer of soil at a depth of 0-30 cm. At the end of each
warm and cold season, the buried cloth is extracted and its weight loss is determined.
Figure 7.17 shows seasonal and annual variation in cellulose decomposition across the
region from the polar regions to the subtropics.
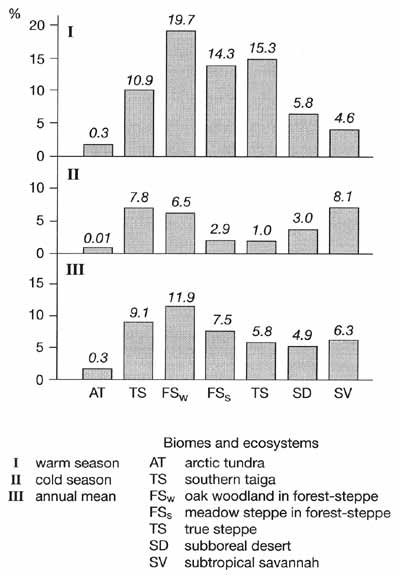
Fig. 7.17 Geography of cellulose degradation in soil (loss of initial
weight per month). After Bazilevich et al. (1993)
Tundra and deserts are characterized by the lowest rates of decomposition which results
from the lack of heat and moisture respectively. In general, the rates of decomposition in
summer are much higher than in winter with the only exception being the arid pistachio
woodlands which occur in areas of subtropical climate with year-round positive
temperatures and a winter precipitation maximum. Generally, the geographical pattern of
cellulose decomposition is very similar to that of NPP. However, it is different from the
spatial distribution of the DPH/NPP ratio, values of which steadily decrease southward.
Spatial patterns of decomposition rates vary seasonally. In summer, the highest
decomposition rates are observed in forest-steppe ecosystems, especially in oak groves,
while the lowest values are typical of polar and arid biomes. This distribution is
explained by the optimal moisture conditions existing in the forest-steppes. In winter,
the lowest (nearly zero) values of decomposition are observed in tundra and in true
steppes. This is due to the low soil temperatures which are typical of steppes, where
snowcover is usually thin. Under forests, soil temperatures are higher. There is a notable
difference between soil temperatures registered in steppes and under oak groves in the
forest-steppe biome. Subtropical woodlands and meadow steppes are characterized by the
highest rates of decomposition.
<<< Spatial Patterns of Phytomass
Distribution, Primary Productivity and Decay | Physical
Geography Index | Geography of Animal Communities
>>>
|


