Please put an active hyperlink to our site (www.rusnature.info) when you copy the materials from this page
Environmental problems of Northern Eurasia
Air Pollution
<<< Air Pollution Data | Environmental Problems Index | Controlling Air
Quality: Cleaner Fuels >>>
Air Pollution before 1990: Industry and Power Generation
Air pollution was serious in the USSR - but how bad was it compared to the
industrialized Western nations? Assessments provide conflicting information: while many
social scientists (e.g., Pryde, 1991; Feshbach and Friendly, 1992; Peterson, 1993) argue
that air pollution was far worse in the USSR than in the West as a result of deficiencies
of the Soviet political system and management practices, reports by the UNEP and WHO
describe air pollution in major Soviet cities as moderate (WHO/UNEP, 1992; Mage et al,
1996).
With regard to air quality, there are a number of important differences between the FSU
and the West. First, in contrast to the Western (especially Western European) countries,
the Soviet economy was characterized by expanded production in the heavy industrial sector
which (together with the cold climate) brought about high energy demands. Second, the lack
of individual wealth restricted private car ownership and traffic congestion, a chronic
Western problem, was not a pressing issue in most Soviet cities. These factors created a
pattern which was different from that observed in the West: while many small and medium
industrial towns in the FSU were extremely polluted, levels of air pollution in large
cities were often lower than in the large Western conurbations. Only two (namely Moscow
and Baku) out of the ten cities with the highest emission discharges in 1988 had a
population over a million; the rest had a population of 140-600 thousand. Another
distinguishing and indeed disturbing feature was the frequent occurrence of highly toxic
contaminants such as various metals, benzo(a)pyrene (a carcinogenic hydrocarbon),
formaldehyde, and phenol. The particularly high concentrations of toxic pollutants were
typical of small industrial towns with climatic conditions favouring pollution build-up,
especially in the towns of Central and Eastern Siberia. Urban planning also had an
important effect on exposure to pollution. Built or industrialized in the 1930s-1950s,
many FSU towns and cities accommodate heavy industry and are not designed for the use of
private cars. These are compact cities with the population living in close proximity to
industrial facilities being exposed to high levels of air pollution.
Heavy industry and power generation were the main contributors to air pollution in the
FSU especially to that by SPM and SO2 (Figure 21.4).
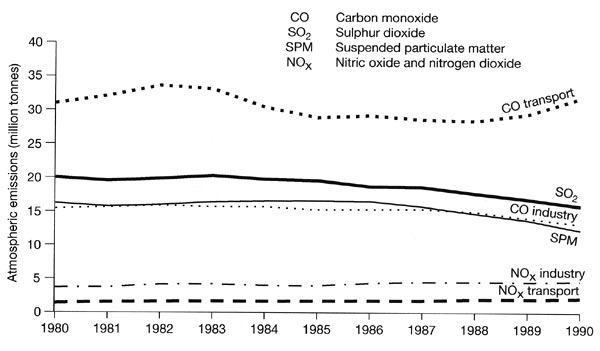
Fig. 21.4 Atmospheric emissions in the former Soviet Union
In the 1980s, the levels of SO2 emissions from European Russia were higher
than in any West European country while emissions from the USSR were approaching those
from the US (Shahgedanova and Burt, 1994; Hill, 1997, 2000). Power generation provided
over 40 per cent of the total SO2 emissions and over 30 per cent of the total
SPM emissions. The amount of pollution emitted by power plants is influenced by the
capacity of a power station and the type of fuel burnt. Sulphur is the most common
impurity contained in coal and oil while its amount in natural gas is negligible, and
therefore high emissions and ambient concentrations of SO2 and SPM were
associated with the large coal-burning stations. Coal was the main type of fuel in the
coal-mining regions of Donbass (Ukraine), Kuzbass (Western Siberia), Kansk-Achinsk region
(Eastern Siberia), and Ekibastuz-Karaganda region in Kazakhstan. The highest SO2
emission densities of nearly 10 tonnes per km2 (according to the official
Soviet reports) occurred in the Donbass which accommodated not only a coal-mining industry
but also the largest steel and iron mills in the country (Shahgedanova and Burt, 1994).
Despite the high energy demands, the contribution of power plants to total SO2
emissions was relatively low: for example, in the UK over 70 per cent of industrial SO2
emissions come from power generation. This relatively low proportion is explained by the
large input of non-ferrous metallurgy, an energy-demanding branch of industry processing
ores with a high sulphur content. In the 1980s, the USSR was the largest producer of such
non-ferrous metals as nickel, copper, and zinc and in 1988 (the peak production year)
non-ferrous smelters contributed 25 per cent of SO2 emissions. Copper and
nickel smelting facilities in Norilsk (the Taymyr peninsula), and Monchegorsk, Nikel, and
Zapolyarny (the Kola peninsula), as well as lead smelting facilities in Balkhash
(Kazakhstan) were among the largest individual contributors, emitting between 200 000
tonnes and 2.4 million tonnes of SO2 per year (Figure 21.5). In Norilsk, a town
with a population of 180 000, SO2 emissions exceeded 12 000 tonnes per capita
(Shahgedanova and Burt, 1994). The Urals, and in particular the steel and iron-producing
city of Magnitogorsk, was another region with extremely high SO2 emissions.
Across the FSU, ferrous metallurgy was the main branch of industry contributing about 40
per cent of total SPM emissions.
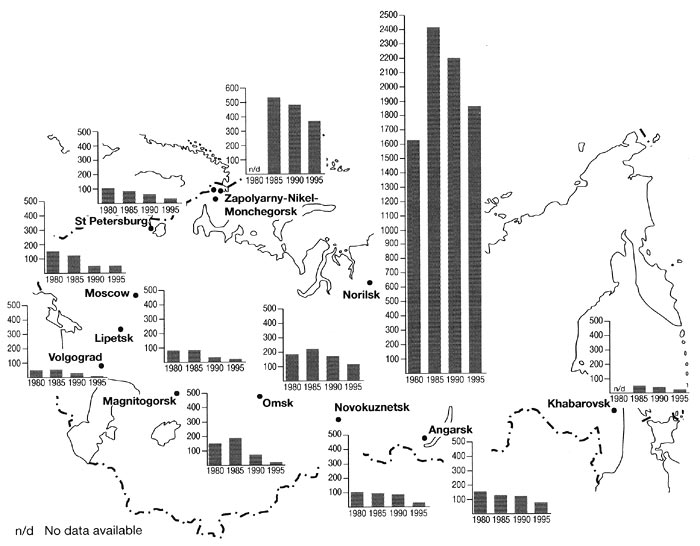
Fig. 21.5 Sulphur dioxide emissions between 1980 and 1995
Ambient concentrations of SO2 and SPM in the FSU cities are difficult to
evaluate because the methods of SO2 sampling and SPM analysis are notoriously
insensitive (UNEP/WHO, 1992). Thus, SPM concentrations are still measured gravimetrically
and the accuracy of these measurements is very poor. Therefore, only approximate
statistics can be given for urban areas where SO2 and SPM levels are high. The
highest concentrations of SO2 are observed in Norilsk where annual mean
concentrations in the 1980s-1990s ranged between 110 and 140 iug m-3 while daily means as
high as 1300-1500 mg m-3 were reported. In many other metal-producing towns
(e.g., towns of the Kola peninsula and the Donbass region) annual concentrations exceeded
70-80 mg m-3 (Shahgedanova and Burt, 1994) which is well above the WHO
guidelines (Table 21.1).
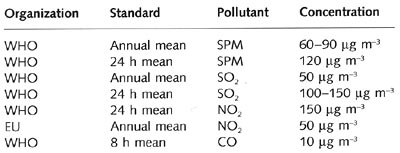
Table 21.1 Air pollution standards and guidelines
Similarly, high SPM levels were observed in towns accommodating coal-burning power
plants, iron and steel mills, and facilities producing construction materials. Those
located in arid environments, where high natural dust concentrations are found,
experienced especially high concentrations. Thus, in many towns of Armenia and Central
Asia annual mean concentrations exceeded 600 mg m-3 while the WMO recommends
that 90 mg m-3 threshold should not be exceeded. In general, high SPM levels
(about 200-300 (ug m-3) were typical of the FSU cities, especially in the warm
season of the year. However, health effects of the high SPM concentrations are difficult
to evaluate because total SPM is measured and no differentiation between SPM fractions is
made. Airborne particulate matter is a complex mixture of organic and inorganic substances
with particle size ranging between coarse material (e.g., soil or sand particles) and fine
aerosols. These are specified by size: e.g., PM10 or PM2 s refer to particles less than 10
or 2.5 Am in diameter. Fine aerosols, formed through the oxidation of gases in the
atmosphere or released during combustion or from industrial processes, usually contain
acid and organic compounds. They can penetrate deeply into the lungs and are damaging to
health. While it is almost certain that coarse material, contributed among other sources
by fugitive dust blown into the air from construction sites or poorly surfaced roads,
constitutes the bulk of SPM pollution, it is fine particulate matter that has the most
detrimental effects on health. Although data on levels of pollution by fine particulate
matter are not available, high levels of benzo(a)pyrene and lead, derived from the
analysis of SPM samples, occur widely in the FSU cities, allowing one to speculate about
the role that SPM pollution plays in causing increased morbidity (Bezuglaya et al., 1993).
Of particular concern was pollution by asbestos, another potent carcinogen, the production
and use of which have been banned in many countries of Western Europe and in the United
States. In the Urals, the small industrial town, Asbest, whose name (meaning asbestos in
Russian) speaks for itself, was among the top five urban areas in the FSU with the highest
emissions of SPM (Shahgedanova and Burt, 1994).
Oxides of nitrogen, of which nitric oxide (NO) and nitrogen dioxide (NO2)
are reported as the most important, are contributed both from stationary sources and
vehicles (Figure 21.4). In contrast to SO2, total NOX emissions in the FSU were
about 2.5 lower than those in the United States, the difference being explained by the far
lower levels of vehicular emissions in the FSU where only about a third of the total NOX
was contributed by transport (Shahgedanova and Burt, 1994; Hill, 1997, 2000). In the late
1980s, power generation provided the main input, contributing 60 per cent of NOX
pollution, while vehicular NOX emissions exceeded those from stationary sources in less
than 30 per cent of all urban areas. Cities with high emissions from traffic included four
out of fifteen capitals of the former republics (Alma-Ata, Ashgabat, Baku, and Tbilisi)
and important administrative centres (e.g., Lvov, Rostov-upon-Don, and Voronezh) and
particularly those located in the southern part of the country which reflected both lower
demand for heating and higher than average private car ownership. In 1988, the number of
private cars in the Northern Caucasus, Transcaucasia, and Central Asia ranged between 23
and 34 per 100 families increasing from 2 to 3 in the 1970s while the national average
increase in private car ownership was from 2 to 17 (Sagers, 1991).
The highest ambient concentrations of NO2, an oxide of nitrogen that
dominates the urban atmosphere, occurred mainly in large administrative and industrial
cities of south-eastern European Russia, eastern and southern Ukraine, the Caucasus, the
southern Urals, and Central Asia as a result of emission patterns and climatic influence.
While nitric oxide (NO) is a primary pollutant, nitrogen dioxide (NO2) is
largely a secondary one that is produced through the oxidation of NO by ozone within
minutes of NO emission. The rates of photochemical oxidation depend on air temperature and
sunlight and for this reason NO2 pollution is often seen as a problem affecting
urban areas with hot summers. There are many such cities in the FSU and frequently annual
mean concentrations of NO2 reached 110-150 mg m-3. Winter episodes
of NO2 pollution can be of a similar severity partly because of the alternative
ways of NO2 production and partly because of unfavourable meteorological
conditions (see above).
While individual sources generated high pollution levels locally, the average national
and regional levels of SO2 and NOX concentrations and the deposition of sulphur
and nitrogen were lower than in Western Europe as a result of the large land mass. With
the exception of a few regions around large sources (e.g., the Kola peninsula), the
highest background concentrations of SO2 are observed along the western border
of the FSU (indicating the transportation of pollutants from Western and Central Europe)
and in the Donbass and the central regions of European Russia where it is caused by the
higher concentration of industry. According to Cooperative Programme for Monitoring and
Evaluation of the Long Range Transmission of Air Pollution in Europe (EMEP), in the early
1990s the total deposition of oxidized sulphur ranged between 0.2 and 0.5 g(S) m-2
across most of the European FSU while in Western and Central Europe sulphur deposition
varied between 0.5 and 2 g(S) m-2 (Tuovinen et al., 1994). Evaluation of
critical loads (quantitative estimates of an exposure to pollutants below which
significant harmful effects on specified sensitive elements of the environment do not
occur) has shown that most of the European FSU (and especially its eastern part) are in no
danger of pollution by sulphur. Acid deposition in the Asiatic territory is lower than in
the European part.
Carbon monoxide (CO) is almost exclusively a vehicular pollutant in the West where over
90 per cent of it is produced by cars (Elsom, 1996). In the FSU, where private car
ownership was low, cars contributed just over 60 per cent of CO total emissions in 1988
while ferrous metallurgy was another major contributor, providing near a half of all CO
emissions from stationary sources (Shahgedanova and Burt, 1994). The highest emissions of
CO occurred either in big cities which combined relatively large number of vehicles with
heavy industry, especially machinery works and petroleum refineries (e.g., Moscow, St.
Petersburg, Tashkent, Tbilisi, Baku, Kiev, Yerevan, and Omsk), or in towns with large
steel mills (Figure 21.6).
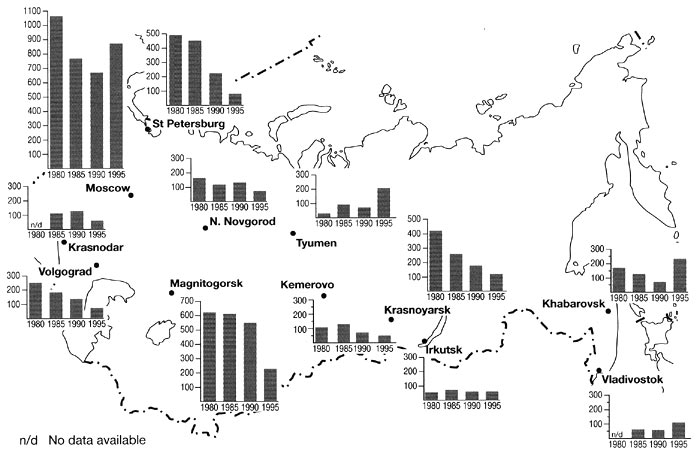
Fig. 21.6 Carbon monoxide emissions between 1980 and 1995
In regional terms, the Donetsk-Dnieper region and the Urals experienced the highest
emissions from stationary sources (3.2 and 2.4 million tonnes, respectively in 1988).
Among individual cities, the Ukrainian city of Krivoy Rog (the major FSU centre for
metallurgy; population 683 000) was ahead of Moscow (population 9.4 million) with 900 000
tonnes against 660 000 tonnes. The production of steel and iron and, consequently,
emissions of CO peaked in 1981; in the late 1980s, a 20 per cent decrease in industrial
output of CO occurred following a decline in metal production. By contrast, a 70 per cent
growth in CO emissions was registered in the gas- and oil-producing regions of Western
Siberia where many new oil and gas wells began operating without adequate pollution
control equipment. Despite the slowly growing car ownership, vehicular emissions of CO
declined by almost 40 per cent throughout the 1980s as the enormous Soviet fleet of
heavy-duty trucks, whose emissions were very poorly controlled, was updated and many
vehicles were converted to run on natural gas, a cheaper as well as cleaner fuel producing
90 per cent less CO than petrol.
Ambient concentrations of CO strongly depend on climate. First, emissions are greatest
when an engine is first started from cold and this effect is exacerbated by low air
temperatures. Second, being emitted mostly from the low-elevated sources, CO levels build
up when ventilation is restricted as a result of atmospheric stability or topography. This
is why it is industrial towns of Siberia which experienced frequent temperature
inversions, and Transcaucasia and Central Asia, which are often located in valleys,
experienced the highest annual mean concentrations of CO of 3.5 5 mg m-3
(Shahgedanova and Burt, 1994). Annual concentrations of 6 mg m-3 were
registered in Yerevan, the capital of Armenia, located in a deep basin subject to
protracted periods of air stagnation. By contrast, Moscow which had only 650 000 cars in
1988, experienced moderate levels of CO pollution of 2-2.5 mg m-3 (Shahgedanova
et al., 1999).
Of great concern is pollution by volatile organic compounds (VOCs), a wide range of
organic compounds including hydrocarbons and oxygenates. Many VOCs (emitted or formed in
the atmosphere) are known to be cancer-inducing; they also have high photochemical
reactivity and contribute considerably to the formation of photochemical smog.
Concentrations of three pollutants have been consistently high in the FSU cities:
benzo(a)pyrene, formaldehyde, and phenol. Particularly dangerous is pollution by
benzo(oc)pyrene, a polycyclic aromatic hydrocarbon which forms during the combustion of
fossil fuels (especially coal) at low temperatures where there is little oxygen. It is
classified as a genotoxic carcinogen, a substance that is capable of causing cancer and
affecting the DNA, and there is no safe level of exposure to this pollutant. Both ambient
concentrations of benzo(a)pyrene and its contents in SPM were measured regularly in 160
cities (Bezuglaya et al., 1993). While the annual mean concentrations averaged across all
the cities varied between 2.5x10⁻³ - 3.5x10⁻³ mg m-3, depending on
the weather, in urban areas accommodating large power plants, steel, and aluminium mills
annual levels ranged between 4x10⁻³ and 6x10⁻³ mg m-3,
reaching 15x10-3 mg m-3. Two other important sources of
benzo(a)pyrene were domestic combustion of coal, and railway transport which uses coal for
heating carriages. Both are typical of Siberian towns especially those located along the
Trans-Siberian railway. Ambient concentrations of benzo(a)pyrene depend on weather and
climate: the largest concentrations occur in winter, where heating needs are high; in
summer, when benzo(a)pyrene is destroyed by photochemical reactions, its levels are
several times lower. A cold winter climate, together with predominantly anticyclonic
weather and complex topography restricting dispersion, enhance pollution by benzo(a)pyrene
in the towns of Southern Siberia. In such cities as Bratsk, Chita, Krasnoyarsk, and many
others monthly mean concentrations in winter exceed 70x10-3 mg m-3.
<<< Air Pollution Data | Environmental Problems Index | Controlling Air
Quality: Cleaner Fuels >>>
Contents of the Air Pollution section:
Other sections of Environmental Problems of Nortern Eurasia:
|
|


